
Food costs are the single largest controllable expense in any restaurant, consuming 28-35% of total revenue on average (National Restaurant Association, 2023). Get this number wrong and no amount of great cooking will keep the business alive. This guide breaks down the science, formulas, and strategies that separate profitable operators from those who guess.
What Is Food Cost Percentage?
Food cost percentage (FCP) measures what fraction of food revenue is consumed by ingredient costs. It is calculated by dividing the cost of food used in a period by total food sales, then multiplying by 100. FCP is the primary diagnostic tool for purchasing discipline, waste, and pricing alignment. When this number drifts, something in the operation is broken.
A Worked Example
The formula is straightforward when applied to real numbers.
- Beginning Inventory: $4,200
- Purchases: $8,500
- Ending Inventory: $3,900
- Total Sales: $28,000
- Result: ($4,200 + $8,500 - $3,900) / $28,000 x 100 = 31.4%
A score of 31.4% sits comfortably in the industry target range of 28-33%.
Benchmarks by Restaurant Type
Food cost targets vary significantly by segment.
Segment | Food Cost % | Notes
Quick Service | 25-31% | Standardized menus, bulk buying
Fast Casual | 28-32% | Fresh ingredients, lean waste
Casual Dining | 30-35% | Broad menus, moderate complexity
Fine Dining | 32-38% | Premium proteins, artisanal sourcing
Institutional | 22-27% | Volume purchasing advantage
(Source: National Restaurant Association, 2023)
Operators who track weekly, not monthly, reduce cost variance by 18% (Cornell Hospitality Quarterly, 2019).

Actual vs. Theoretical Cost
Theoretical cost is what you should spend based on standard recipes and portion specs. It is the ideal outcome with zero waste or deviation. Actual cost is what you really spent, captured through physical inventory counts. It includes every error, every over-portion, and every spoiled item.
The gap between them is called variance. A large variance exposes over-portioning, spoilage, and theft. Small variance means the kitchen runs tight.
V = FCP_actual - FCP_theoretical
Where V = Variance (%), FCP_actual = Actual Food Cost %, FCP_theoretical = Theoretical Food Cost %
Variance | Status | Action
0.0-0.9% | Excellent | Maintain current practices
1.0-1.9% | Acceptable | Review portioning
2.0-2.9% | Concerning | Full waste audit required
3.0%+ | Critical | Investigate theft or recipe drift
(Source: Miller & Pavesic, Restaurant Manager's Handbook)
Recipe Costing
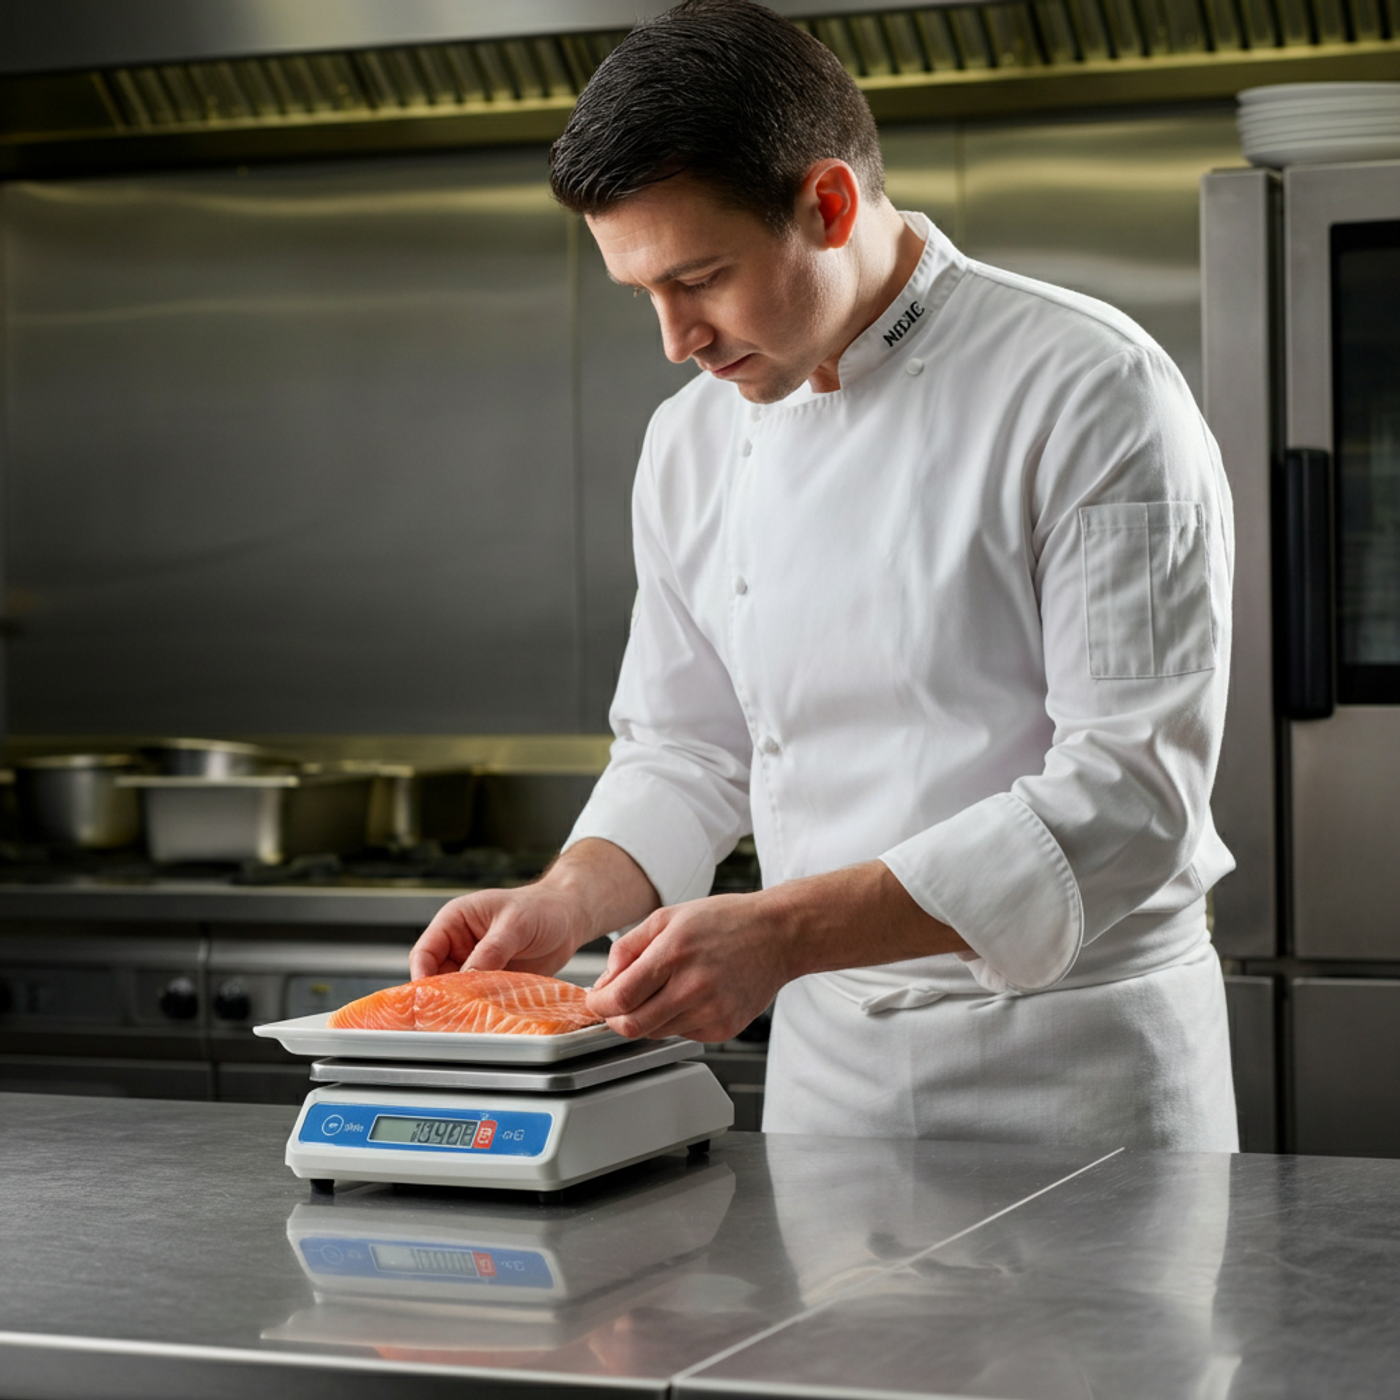
Recipe costing calculates the exact ingredient cost per dish. It is the foundation of defensible menu pricing and the only way to know if a dish is actually making money. Without it, operators are guessing. With it, every pricing decision is backed by data.
(1) C_dish = sum of (u_i x q_i) for all ingredients i
(2) FCP_item(%) = (C_dish / P_sell) x 100
(3) CM = P_sell - C_dish
C_dish = total food cost per dish ($)
u_i = unit cost of ingredient i ($/unit)
q_i = quantity of ingredient i used
FCP_item = food cost % for the dish
CM = contribution margin ($)
P_sell = selling price ($)
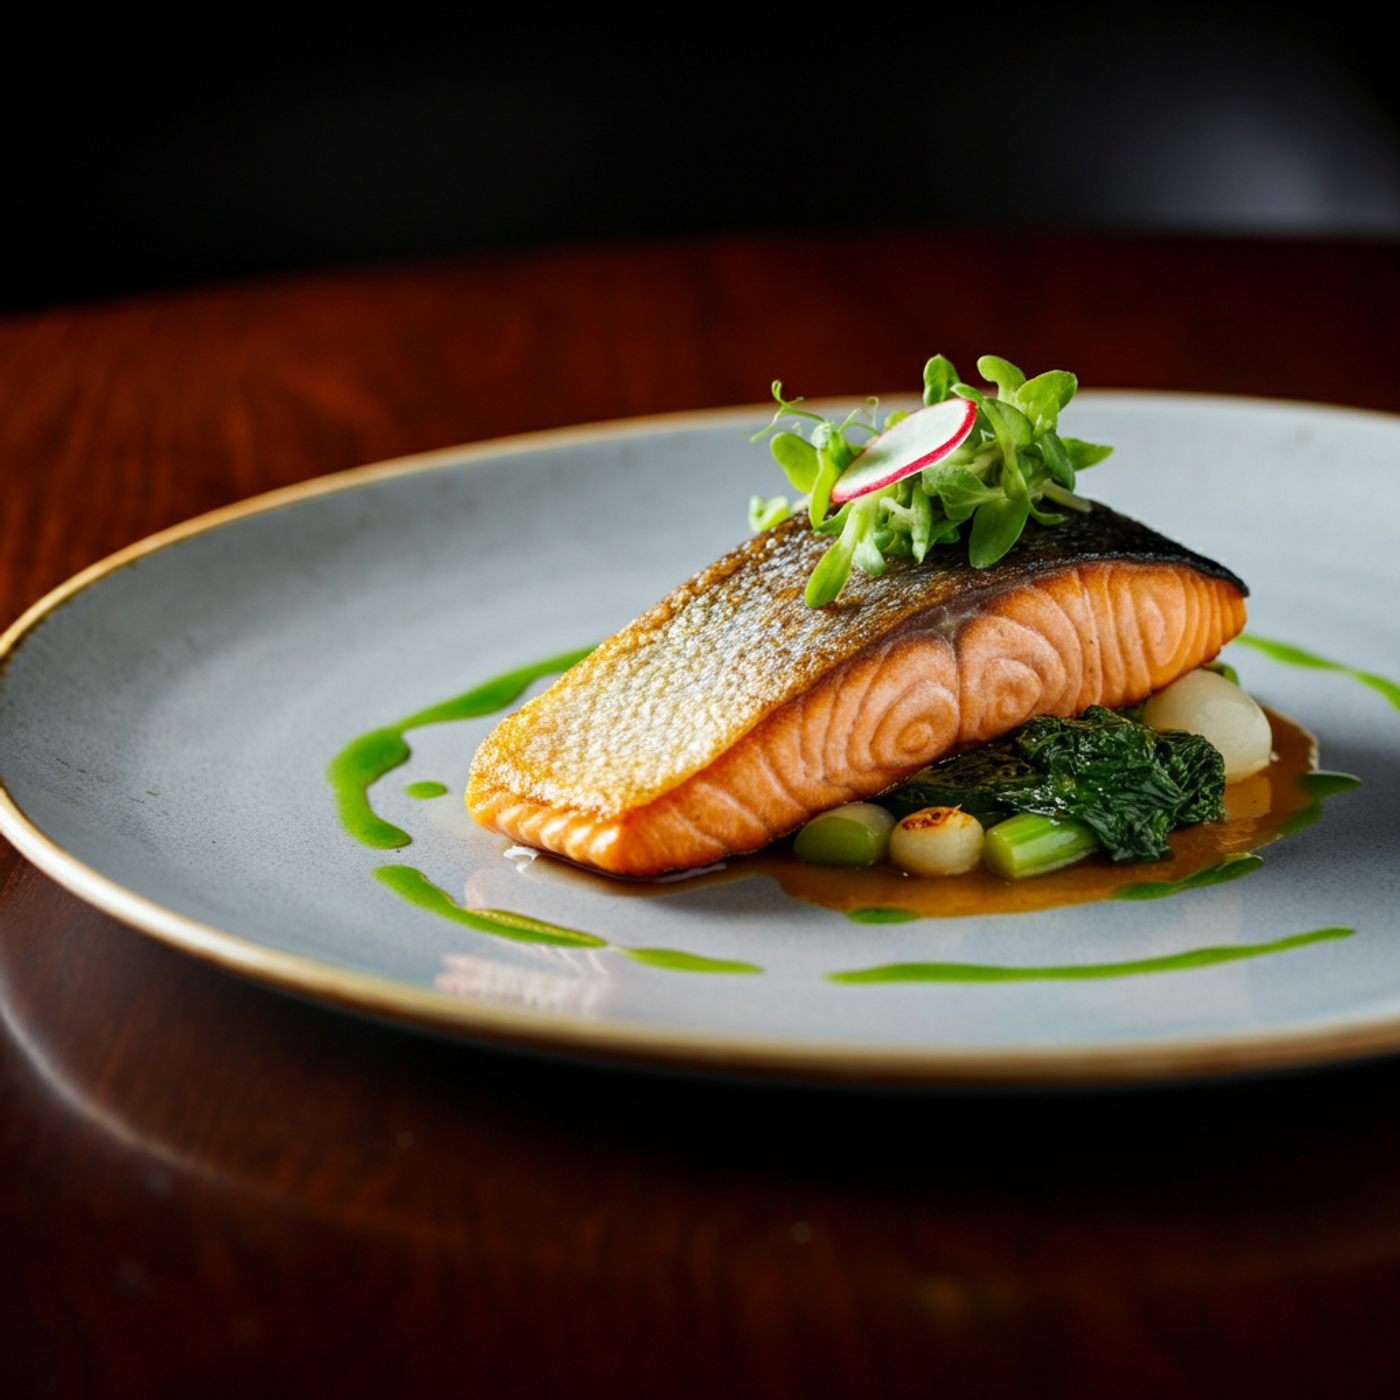
- Dish: Pan-Seared Salmon
- Salmon 200g x $0.042/g = $8.40
- Vegetables 150g x $0.012/g = $1.80
- Sauce = $0.60
- C_dish = $10.80
- P_sell = $34.00
- FCP_item = (10.80 / 34.00) x 100 = 31.8%
- CM = $34.00 - $10.80 = $23.20
The Menu Engineering Matrix
In 1982, Kasavana and Smith at Michigan State University developed a framework that changed how restaurants manage menus. Every dish is classified by two dimensions: how popular it is, and how profitable it is. The result is a 2x2 matrix with four quadrants, each requiring a different strategy.
Research shows that applying this framework drives contribution margin up by 10-15% with no change to ingredients or kitchen operations (Kasavana & Smith, 1982).
Quadrant | Popularity | Profitability | Strategy
Stars | High | High | Promote prominently
Plowhorses | High | Low | Reprice or reduce portions
Puzzles | Low | High | Reposition with better descriptions
Dogs | Low | Low | Remove or completely overhaul
(Source: Kasavana & Smith, 1982)
6 Ways to Cut Food Costs (Backed by Data)
These six strategies are the most rigorously validated in the hospitality literature.
- Weekly inventory counts. Weekly counting cuts cost variance by 18% vs. monthly tracking (Cornell, 2019). For proteins and seafood, daily spot counts are even better.
- Recipe costing software. Digital tools reduce food costs by 3-5% compared to manual methods (Toast, 2023). Prices update automatically when supplier costs change.
- Portion control training. Structured training programs cut kitchen waste by 30% within 6 months (Culinary Institute of America).
- Quarterly vendor contracts. Locking in quarterly supply contracts instead of month-to-month agreements cuts COGS by 2-4%.
- Menu engineering reviews. Quarterly redesign using the Kasavana & Smith framework lifts contribution margin by 10-15%.
- AI demand forecasting. AI-powered tools reduce over-purchasing by 15-25% by predicting demand from sales history, weather, and local events (NRA, 2024).
The Bottom Line
Food cost is not intuition, it is a science. Operators who measure weekly, train their teams, and apply recipe costing consistently outperform the industry. The data is clear and the methods are proven.
The restaurants winning on margin today are the ones treating cost management as a data discipline, not an accounting task.